lab10 : Functions and Visualization
| num | ready? | description | assigned | due |
|---|---|---|---|---|
| lab10 | true | Functions and Visualization | Sun 08/27 01:15PM | Tue 08/29 04:45PM |
This lab is optional. If you are interesed in data analytics, it is a good lab for you!
Welcome to lab 10! We’ll practice functions and the table method apply from this ebook description. We’ll also learn about visualization from a chapter in data8.
First, create a lab10 repo
Go to github.com and create a new repo called spis16-lab10-Name-Name using Method 1. When creating the repo import the starter code from this git repo: https://github.com/ucsd-cse-spis-2017/lab10starter
Then use git clone to clone this into your ~/github directory.
In the repo, you will see that there are three files, world_population.csv and imdb.csv. They are used in this lab for data analysis.
Step 2: start ipython and get into the pylab mode
Run commands in terminal
ipython
%pylab
This is where we will start to use tables to read in and analyze data. First type in
import numpy as np
from datascience import *
import matplotlib
import matplotlib.pyplot as plt
plt.style.use('fivethirtyeight')
This will import the right packages. The matplotlib package will allow us to have graphing capabilities
Now let’s start the lab. When turning in the lab, turn in the code that you complete for each of the questions in a python file. Clearly number the answers such as #Q2.1 etc.
1. Functions and CEO Incomes
Let’s start with a real data analysis task. We’ll look at the 2015 compensation of CEOs at the 100 largest companies in California. The data were compiled for a Los Angeles Times analysis here, and ultimately came from filings mandated by the SEC from all publicly-traded companies. Two companies have two CEOs, so there are 102 CEOs in the dataset.
We’ve copied the data in raw form from the LA Times page into a file called raw_compensation.csv. (The page notes that all dollar amounts are in millions of dollars.)
Run the following command in ipython
raw_compensation = Table.read_table('raw_compensation.csv')
raw_compensation
Question 1.1 We want to compute the average of the CEOs’ pay. Try running the statements and You should see an error
np.average(raw_compensation.column("Total Pay"))
Let’s examine why this error occured by looking at the values in the “Total Pay” column. Use the type function and set total_pay_type to the type of the first value in the “Total Pay” column.
total_pay_type = ...
total_pay_type
Question 1.2. You should have found that the values in “Total Pay” column are numpy.ndarray which means it is not data, but most likely just text (string). It doesn’t make sense to take the average of the text values, so we need to convert them to numbers if we want to do this. Extract the first value in the “Total Pay” column. It’s Mark Hurd’s pay in 2015, in millions of dollars. Call it mark_hurd_pay_string.
mark_hurd_pay_string = ...
mark_hurd_pay_string
Question 1.3. Convert mark_hurd_pay_string to a number of dollars. The string method strip will be useful for removing the dollar sign; it removes a specified character from the start or end of a string. For example, the value of "100%".strip("%") is the string "100". You’ll also need the function float, which converts a string that looks like a number to an actual number. Last, remember that the answer should be in dollars, not millions of dollars.
mark_hurd_pay = ...
mark_hurd_pay
To compute the average pay, we need to do this for every CEO. But that looks like it would involve copying this code 102 times.
This is where functions come in. First, we’ll define a new function, giving a name to the expression that converts “total pay” strings to numeric values. Later in this lab we’ll see the payoff: we can call that function on every pay string in the dataset at once.
Question 1.4. Copy the expression you used to compute mark_hurd_pay as the return expression of the function below, but replace the specific mark_hurd_pay_string with the generic pay_string name specified in the first line of the def statement.
def convert_pay_string_to_number(pay_string):
    """Converts a pay string like '$100' (in millions) to a number of dollars."""
    return ...
Running that cell doesn’t convert any particular pay string. Instead, it creates a function called convert_pay_string_to_number that can convert any string with the right format to a number representing millions of dollars.
We can call our function just like we call the built-in functions we’ve seen. It takes one argument, a string, and it returns a number.
convert_pay_string_to_number('$42')
convert_pay_string_to_number(mark_hurd_pay_string)
# We can also compute Safra Catz's pay in the same way:
convert_pay_string_to_number(raw_compensation.where("Name", are.containing("Safra")).column("Total Pay").item(0))
What have we gained? Well, without the function, we’d have to copy that 10**6 * float(pay_string.strip("$")) stuff each time we wanted to convert a pay string. Now we just call a function whose name says exactly what it’s doing.
Soon, we’ll see how to apply this function to every pay string in a single expression. First, let’s write some more functions.
2. Defining functions
Let’s write a very simple function that converts a proportion to a percentage by multiplying it by 100. For example, the value of to_percentage(.5) should be the number 50. (No percent sign.)
A function definition has a few parts.
def
It always starts with def (short for define):
def
Name
Next comes the name of the function. Let’s call our function to_percentage.
def to_percentage
Signature
Next comes something called the signature of the function. This tells Python how many arguments your function should have, and what names you’ll use to refer to those arguments in the function’s code. to_percentage should take one argument, and we’ll call that argument proportion since it should be a proportion.
def to_percentage(proportion)
We put a colon after the signature to tell Python it’s over.
def to_percentage(proportion):
Documentation
Functions can do complicated things, so you should write an explanation of what your function does. For small functions, this is less important, but it’s a good habit to learn from the start. Conventionally, Python functions are documented by writing a triple-quoted string:
def to_percentage(proportion):
    """Converts a proportion to a percentage."""
Body
Now we start writing code that runs when the function is called. This is called the body of the function. We can write anything we could write anywhere else. First let’s give a name to the number we multiply a proportion by to get a percentage.
def to_percentage(proportion):
    """Converts a proportion to a percentage."""
    factor = 100
return
The special instruction return in a function’s body tells Python to make the value of the function call equal to whatever comes right after return. We want the value of to_percentage(.5) to be the proportion .5 times the factor 100, so we write:
def to_percentage(proportion):
    """Converts a proportion to a percentage."""
    factor = 100
    return proportion * factor **Question 2.1.** Define `to_percentage` in the cell below.  Call your function to convert the proportion .2 to a percentage.  Name that percentage `twenty_percent`.
def ...
    """ ... """
    ... = ...
    return ...

twenty_percent = ...
twenty_percent
Like the built-in functions, you can use named values as arguments to your function.
Question 2.2. Use to_percentage again to convert the proportion named a_proportion (defined below) to a percentage called a_percentage.
Note: You don’t need to define to_percentage again! Just like other named things, functions stick around after you define them.
a_proportion = 2**(.5) / 2
a_percentage = ...
a_percentage
Here’s something important about functions: the names assigned within a function body are only accessible within the function body. Once the function has returned, those names are gone. So even though you defined factor = 100 inside to_percentage above and then called to_percentage, you cannot refer to factor anywhere except inside the body of to_percentage:
Question 2.3. Define a function called disemvowel. It should take a single string as its argument. (You can call that argument whatever you want.) It should return a copy of that string, but with all the characters that are vowels removed. (In English, the vowels are the characters “a”, “e”, “i”, “o”, and “u”.)
Hint: To remove all the “a”s from a string, you can use that_string.replace("a", ""). And you can call replace multiple times.
def disemvowel(a_string):
    ...
    ...

# An example call to your function.  (It's often helpful to run
# an example call from time to time while you're writing a function,
# to see how it currently works.)
disemvowel("Can you read this without vowels?")
Calls on calls on calls
Just as you write a series of lines to build up a complex computation, it’s useful to define a series of small functions that build on each other. Since you can write any code inside a function’s body, you can call other functions you’ve written.
If a function is a like a recipe, defining a function in terms of other functions is like having a recipe for cake telling you to follow another recipe to make the frosting, and another to make the sprinkles. This makes the cake recipe shorter and clearer, and it avoids having a bunch of duplicated frosting recipes. It’s a foundation of productive programming.
For example, suppose you want to count the number of characters that aren’t vowels in a piece of text. One way to do that is this to remove all the vowels and count the size of the remaining string.
Question 2.4. Write a function called num_non_vowels. It should take a string as its argument and return a number. The number should be the number of characters in the argument string that aren’t vowels.
Hint: The function len takes a string as its argument and returns the number of characters in it.
def num_non_vowels(a_string):
    """The number of characters in a string, minus the vowels."""
    ...
Functions can also encapsulate code that does things rather than just computing values. For example, if you call print inside a function, and then call that function, something will get printed.
The movies_by_year dataset has information about movie sales in recent years. You can read it in and show the first 10 rows by doing
movies_by_year = Table.read_table("movies_by_year.csv")
movies_by_year
Suppose you’d like to display the year with the 5th-highest total gross movie sales, printed in a human-readable way. You might do this:
rank = 5
fifth_from_top_movie_year = movies_by_year.sort("Total Gross", descending=True).column("Year").item(rank-1)
print("Year number", rank, "for total gross movie sales was:", fifth_from_top_movie_year)
After writing this, you realize you also wanted to print out the 2nd and 3rd-highest years. Instead of copying your code, you decide to put it in a function. Since the rank varies, you make that an argument to your function.
Question 2.5. Write a function called print_kth_top_movie_year. It should take a single argument, the rank of the year (like 2, 3, or 5 in the above examples). It should print out a message like the one above. It shouldn’t have a return statement.
def print_kth_top_movie_year(k):
    # Our solution used 2 lines.
    ...
    ...

# Example calls to your function:
print_kth_top_movie_year(2)
print_kth_top_movie_year(3)
3. applying functions
Defining a function is a lot like giving a name to a value with =. In fact, a function is a value just like the number 1 or the text “the”!
For example, we can make a new name for the built-in function max if we want:
our_name_for_max = max
our_name_for_max(2, 6)
The old name for max is still around:
max(2, 6)
Try just writing max or our_name_for_max (or the name of any other function) in a cell, and run that cell. Python will print out a (very brief) description of the function.
max
Why is this useful? Since functions are just values, it’s possible to pass them as arguments to other functions. Here’s a simple but not-so-practical example: we can make an array of functions.
make_array(max, np.average, are.equal_to)
Question 3.1. Make an array containing any 3 other functions you’ve seen. Call it some_functions.
some_functions = ...
some_functions
Working with functions as values can lead to some funny-looking code. For example, see if you can figure out why this works:
make_array(max, np.average, are.equal_to).item(0)(4, -2, 7)
Here’s a simpler example that’s actually useful: the table method apply.
apply calls a function many times, once on each element in a column of a table. It produces an array of the results. Here we use apply to convert every CEO’s pay to a number, using the function you defined:
raw_compensation.apply(convert_pay_string_to_number, "Total Pay")
Here’s an illustration of what that did:
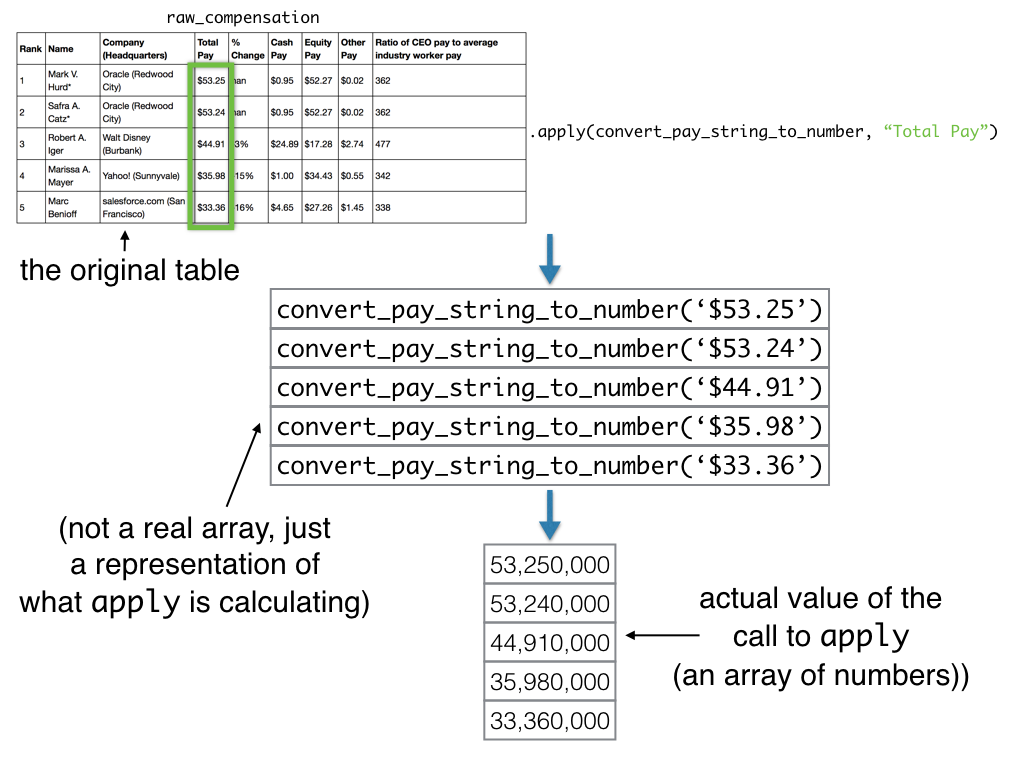
Note that we didn’t write something like convert_pay_string_to_number() or convert_pay_string_to_number("Total Pay"). The job of apply is to call the function we give it, so instead of calling convert_pay_string_to_number ourselves, we just write its name as an argument to apply.
Question 3.2. Using apply, make a table that’s a copy of raw_compensation with one more column called “Total Pay ($)”. It should be the result of applying convert_pay_string_to_number to the “Total Pay” column, as we did above. Call the new table compensation.
compensation = raw_compensation.with_column(
    "Total Pay ($)",
    ...
compensation
Now that we have the pay in numbers, we can compute things about them.
Question 3.3. Compute the average total pay of the CEOs in the dataset.
average_total_pay =
average_total_pay
4. Histograms
Earlier, we computed the average pay among the CEOs in our 102-CEO dataset. The average doesn’t tell us everything about the amounts CEOs are paid, though. Maybe just a few CEOs make the bulk of the money, even among these 102.
We can use a histogram to display more information about a set of numbers. The table method hist takes a single argument, the name of a column of numbers. It produces a histogram of the numbers in that column.
Question 4.1. Make a histogram of the pay of the CEOs in compensation. Hint: type help(compensation.hist) to know more about drawing histograms. Can you count number of CEOs who make more than 30 million a year?
...
Question 4.2. Looking at the histogram, how many CEOs made more than $30 million? (Answer the question with code. Hint: Use the table method where and the property num_rows.)
num_ceos_more_than_30_million = ...
Great job! :D You’re finished with lab 10!